Digital Frequency Meter
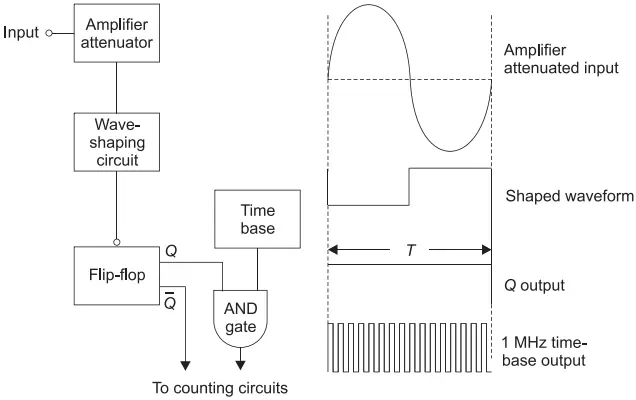
An instrument which displays the frequency of a periodic electrical signal is known as digital frequency meter. The block diagram of a digital frequency meter system, shown in Figure 1 consists of an amplifier or an attenuator to which the input signal is applied. This performs the function of amplification or attenuation of the signal as per the requirement before passing it to the wave-shaping circuit.
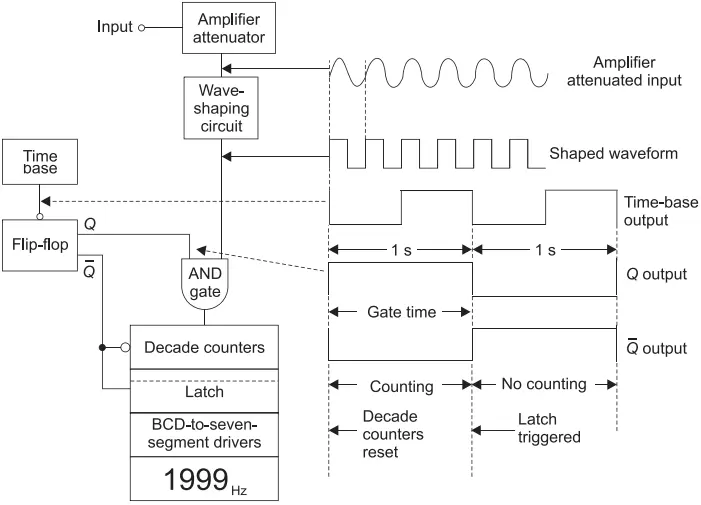
The wave-shaping circuit converts the input signal into a pulse or square waveform without changing its frequency. The presence of this circuit implies that input can be any repetitive-type waveform, such as sinusoidal, triangular or square wave.
The output of the wave-shaping circuit is then applied to a two-input AND gate. The other input of the AND gate is the Q output from the flip-flop.
When the flip-flop Q terminal is high, pulses pass through the AND gate and are counted. Here, the flip-flop is controlled by a time-base circuit. When the output waveform of time-base circuit goes in the negative direction, the flip-flop changes its state at each instant.
For example, if the time-base output frequency is 1 Hz, the flip-flop output Q will be an alternating high and low wave for a time period of 1 s each.
Now, the output from the wave-shaping circuit will pass through AND gate when the flip-flop Q output is high for a period of 1 s. Thus, the total count represented by the counters indicates the frequency of the input in hertz.
The negative-going edge of Q bar output of the flip-flop is used to reset the counters so that a count always begins from zero. The digital display is made readable by employing latch or display / enable circuits.
The latch is triggered by the positive-going edge of Qbar output of the flip-flop at the end of counting time. The output of the display remains constant until the latch is again triggered and if required any changes can be made in the output at this instant. When the flip-flops are connected in cascade, they can be used for frequency division purpose.
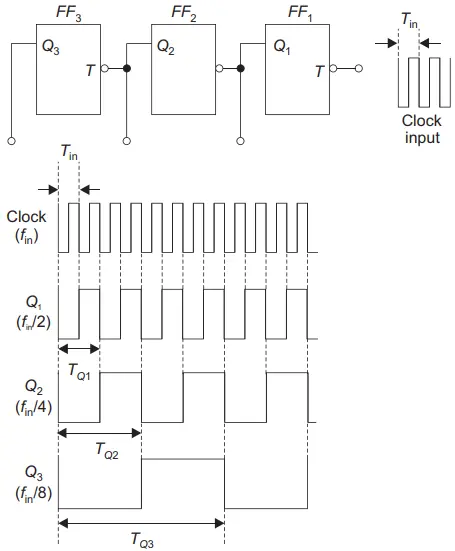
Figure 2 shows three flip-flops connected in cascade and the respective waveforms for each of them are shown. From the figure, we can say that everytime two input pulses are applied, there occurs a change in the state of flip-flop 1 and hence, the output wave from Q1 has a time period twice to that of the triggering or clock input time period.
If Tin is the input time period, then the time period of different waves are related as:
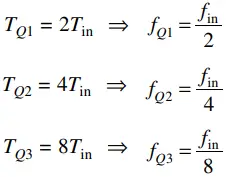
Therefore, the output frequency triggered by a clock input at any point in a digital register is given as
f(n) = fin /2n, where n is the number of flip-flops from the clock input to the output or bit number at the output.
Similarly, by using decade counters, the frequencies can be divided by tens. This concept is utilized to create multi-range frequency meter. By using crystal oscillator with a number of decade counters, accurate time periods of 10 ms, 100 ms, 1 ms and many more can be generated and thus several ranges can be obtained.
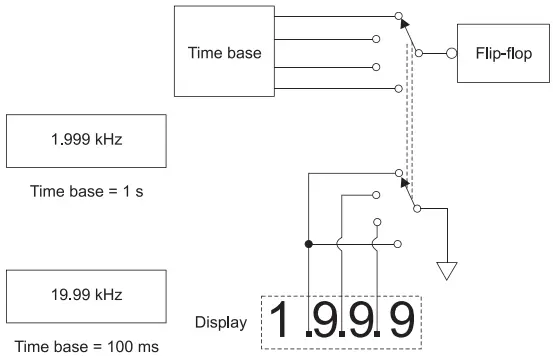
In Figure 1, the unit Hz is displayed along with the numerical value. Now, if the decimal point after first number is energized, the unit displayed will be kHz. Further, if a different range, say 100 ms is selected, the decimal point is shifted to the right displaying a value of 19.99 kHz.
Thus, as the range is changed, the decimal point also gets shifted accordingly by a switching arrangement as shown in Figure 3. The maximum pulse count that can be obtained is 1999 pulses per ms, or 1.999 MHz.
A frequency meter incorporating decade counters is shown in Figure 4 in which a Schmitt trigger is used as an amplifier or an attenuator and 1 MHz frequency is converted to 1 Hz, 10 Hz, 100 Hz, gating pulses by decade counter in cascade arrangement.

Accuracy Specifications
The accuracy of a frequency meter is specified as ± (1 LSD + time-base error). Here, a possible gating error of ± 1 cycle occurs in the LSD of the count during the timing period. The AND gate can be switched on or off by the time-base circuit when a pulse from wave-shaping circuit is applied to it.
This results in partial pulses at the output of AND gate which may or may not trigger the counter. Thus, an error is always present in the count.
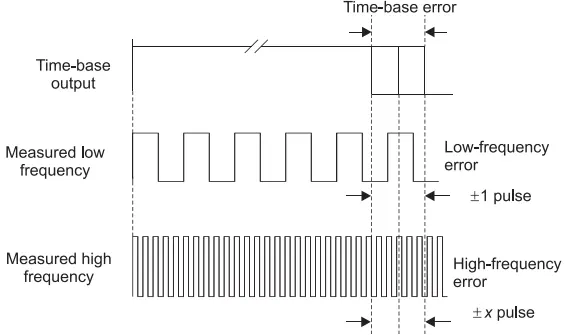
The time-base error corresponds to the errors generated by the crystal-controlled oscillator due to supply voltage changes, variations in temperature, and aging of crystals. The total amount of error in the measurement depends upon the frequency measured as shown in Figure 5.
However, adopting some precaution methods and using high quality time bases, this error can be reduced significantly to less than 1 × 10⁻⁶. While measuring a frequency using frequency meter, the lowest possible range should be selected to ensure highest accuracy.
Reciprocal Counting
At low frequencies, ± 1 count error is greater than the time-base error, whereas at high frequencies, ± 1 count error is smaller than time-base error. At frequencies less than 100 Hz, the percentage error due to ± 1 count is greater than 1%.
Therefore, at low frequencies, the greatest measurement error occurs which can be reduced by a technique known as reciprocal counting technique as discussed here.
Figure 1 is modified to rearrange the frequency meter system as shown in Figure 6 in which the reshaped input wave whose frequency is to be measured is applied from wave-shaping circuit to the flip-flop to toggle it and oscillator frequency from time base is applied directly to the input of AND gate.
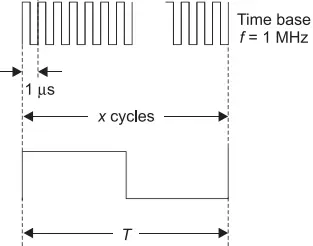
The pulses from the time base, that is, 1 MHz oscillator frequency are passed to the counters during a time period of input wave. Now, when a 100 Hz input wave to be measured is applied, the AND gate will pass the pulses for a time period of 1 / 100 Hz = 10 ms and the time period of each cycle from 1 MHz oscillator is 1 ms.
Hence, during time period T, the number of counted pulses n is given as: n = 10 ms /1 ms = 10000 which is displayed as 10000 µs and its reciprocal determines the frequency.
Here, we can say that the accuracy of measurement is 0.01% (that is, ± 1 count in 10000) for a measurement of 100 Hz which is lower than the straight counting technique having error greater than 1%.
For frequencies lower than 100 Hz, this technique gives even better results. However, the straight counting method is well suited for high frequency measurements.
Applications of Digital Frequency Meter
The digital frequency meter system can be used to measure many more quantities in addition to frequency as discussed here.
Measuring pulse time period and width: The reciprocal counting technique can be used to measure the time period and width of a pulse. To measure the time period, no modification is required in the existing circuit (see Figure 6). The circuit can be used to measure the time period. The waveform is shown in Figure 7(a).
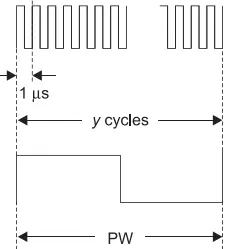
However, to measure the width of the input pulse, the flip-flop is made to toggle on both positive- and negative-going pulses as shown in Figure 7(b). The time between the two events can be measured by some digital counters that have a start and stop input.
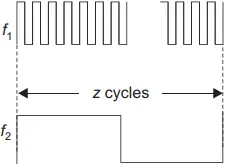
Measuring frequency ratio: The digital frequency meter is used for measuring the ratio of two frequencies. The AND gate is applied with the higher frequency input wave via an appropriate wave-shaping circuit in place of time base, whereas the lower frequency is applied as an input to the circuit in Figure 6.
Now, the number of high-frequency cycles is counted during the time period of low frequency. Ten cycles are counted during the time period of a low frequency cycle if the ratio between both the waves is 10 and is displayed as the result. The waveforms are shown in Figure 8.
These methods can be utilized to measure the phase difference between two waveforms.