Insulation coordination of Electrical Equipment
Insulation coordination means the correlation of the insulation of the various equipment in a power system to the insulation of the protective devices used for the protection of those equipment against overvoltages.
In a power system, various equipment like transformers, circuit breakers, bus supports, etc. have different breakdown voltages and hence the volt-time characteristics. So that all the equipment should be properly protected it is desired that the insulation of the various protective devices must be properly coordinated.
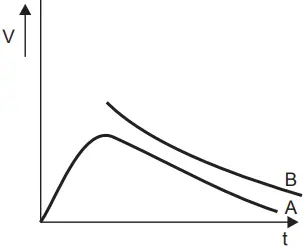
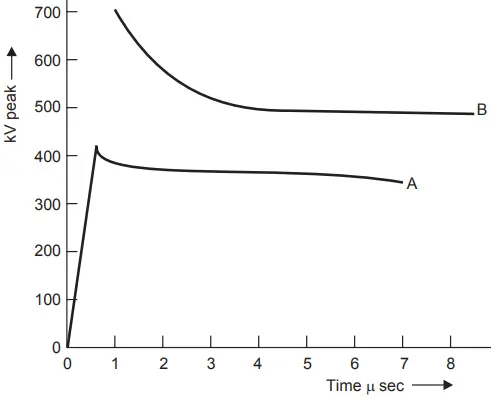
The basic concept of insulation coordination is illustrated in Figure 1. Curve A is the volt-time curve of the protective device and B is the volt-time curve of the equipment to be protected.
Figure 1 shows the desired positions of the volt-time curves of the protecting device and the equipment to be protected. Thus, any insulation having a withstand voltage strength above the insulation strength of curve B is protected by the protective device of curve A.
The ‘volt-time curve’ expression will be used very frequently in this article. It is, therefore, necessary to understand the meaning of this expression.
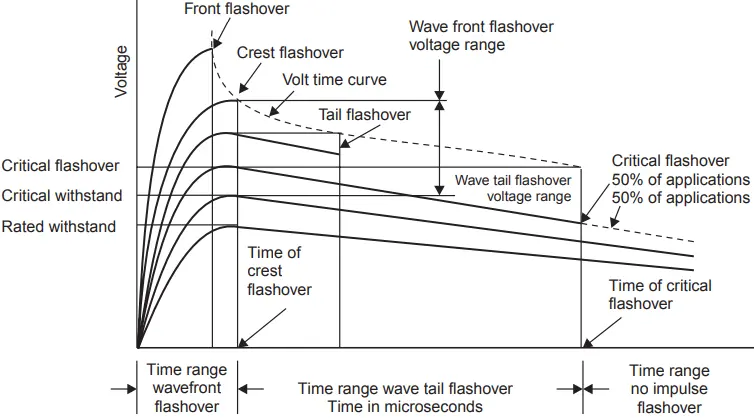
Volt-Time Curve: The breakdown voltage for a particular insulation of flashover voltage for a gap is a function of both the magnitude of voltage and the time of application of the voltage. The volt-time curve is a graph showing the relation between the crest flashover voltages and the time to flashover for a series of impulse applications of a given wave shape. For the construction of the volt-time curve, the following procedure is adopted. Waves of the same shape but of different peak values are applied to the insulation whose volt-time curve is required. If a flashover occurs on the front of the wave, the flashover point gives one point on the volt-time curve.
The other possibility is that the flashover occurs just at the peak value of the wave; this gives another point on the V-T curve.
The third possibility is that the flashover occurs on the tail side of the wave. In this case to find the point on the V-T curve, draw a horizontal line from the peak value of this wave and also draw a vertical line passing through the point where the flashover takes place. The intersection of the horizontal and vertical lines gives the point on the V-T curve. This procedure is nicely shown in Figure 2.
The overvoltages against which coordination is required could be caused on the system due to system faults, switching operations, or lightning surges. For lower voltages, normally up to about 345 kV, overvoltages caused by system faults or switching operations do not cause damage to equipment insulation although they may be detrimental to protective devices.
Overvoltages caused by lightning are of sufficient magnitude to affect the equipment insulation whereas for voltages above 345 kV, it is these switching surges that are more dangerous for the equipment than the lightning surges.
The problem of coordinating the insulation of the protective equipment involves not only guarding the equipment insulation but also it is desired that the protecting equipment should not be damaged.
To assist in the process of insulation coordination, standard insulation levels have been recommended. These insulation levels are defined as follows.
Basic impulse insulation levels (BIL) are reference levels expressed in impulse crest voltage with a standard wave not longer than 1.2/50 µ sec wave. Apparatus insulation as demonstrated by suitable tests shall be equal to or greater than the basic insulation level. The problem of insulation coordination can be studied under three steps:
- Selection of a suitable insulation which is a function of reference class voltage (i.e., 1.05 × operating voltage of the system). Table 1 gives the BIL for various reference class voltages.
- The design of the various equipment such that the breakdown or flashover strength of all insulation in the station equals or exceeds the selected level as in (1).
- Selection of protective devices that will give the apparatus as good protection as can be justified economically.
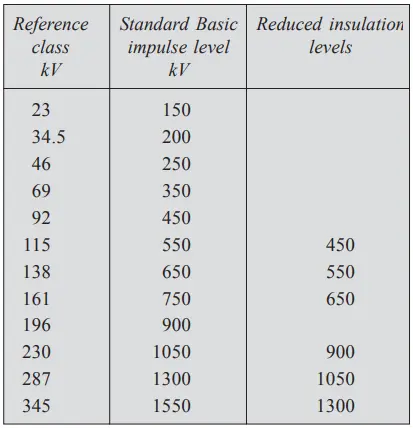
The above procedure requires that the apparatus to be protected shall have a withstand test value not less than the kV magnitude given in the second column of Table 1, irrespective of the polarity of the wave positive or negative, and irrespective of how the system was grounded.
The third column of the table gives the reduced insulation levels which are used for selecting insulation levels of solidly grounded systems and for systems operating above 345 kV where switching surges are of more importance than lightning surges.
At 345 kV, the switching voltage is considered to be 2.7 p.u., i.e., 345 × 2.7 = 931.5 kV which corresponds to the lightning level. At 500 kV, however, 2.7 p.u. will mean 2.7 × 500 = 1350 kV switching voltage which exceeds the lightning voltage level. Therefore, the ratio of switching voltage to operating voltage is reduced by using the switching resistances between the C.B. contacts.
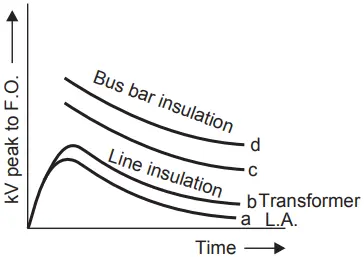
For 500 kV it has been possible to obtain this ratio as 2.0 and for 765 kV it is 1.7. With further increase in operating voltages, it is hoped that the ratio could be brought to 1.5. So, for switching voltages the reduced levels in the third column are used i.e., for 345 kV, the standard BIL is 1550 kV but if the equipment can withstand even 1425 kV or 1300 kV it will serve the purpose. Figure 3 gives the relative position of the volt-time curves of the various equipment in a substation for proper coordination.
To illustrate the selection of the BIL of a transformer to be operated on a 138 kV system assume that the transformer is of large capacity and its star point is solidly grounded. The grounding is such that the line-to-ground voltage of the healthy phase during a ground fault on one of the phases is say 74% of the normal L-L voltage.
Allowing for 5% overvoltage during operating conditions, the arrester rms operating voltage will be 1.05 × 0.74 × 138 = 107.2 kV. The nearest standard rating is 109 kV. The characteristic of such an L.A. is shown in Figure 4.
From the figure the breakdown value of the arrester is 400 kV. Assuming a 15% margin plus 35 kV between the insulation levels of L.A. and the transformer, the insulation level of the transformer should be at least equal to 400 + 0.15 × 400 + 35 = 495 kV.
From Figure 4 (or from the table, the reduced level of the transformer for 138 kV is 550 kV) the insulation level of the transformer is 550 kV; therefore a lightning arrester of 109 kV rating can be applied.
It is to be noted that low voltage lines are not as highly insulated as higher voltage lines so lightning surges coming into the station would normally be much less than in a higher voltage station because the high voltage surges will flashover the line insulation of low voltage line and not reach the station.
The traditional approach to insulation coordination requires the evaluation of the highest overvoltages to which equipment may be subjected during operation and the selection of a standardized value of withstand impulse voltage with a suitable safety margin.
However, it is realized that overvoltages are a random phenomenon and it is uneconomical to design plants with such a high degree of safety that they sustain the infrequent ones.
It is also known that insulation designed on this basis does not give 100% protection and insulation failure may occur even in well-designed plants, therefore, it is desired to limit the frequency of insulation failures to the most economical value taking into account equipment cost and service continuity.
Insulation coordination, therefore, should be based on evaluation and limitation of the risk of failure rather than on the prior choice of a safety margin.
The modern practice, therefore, is to make use of probabilistic concepts and statistical procedures, especially for very high-voltage equipment which might later on be extended to all cases where a close adjustment of insulation to system conditions proves economical. The statistical methods even though laborious are quite useful.
Statistical Methods for Insulation Coordination
Both the overvoltages due to lightning or switching and the breakdown strength of the insulating media are statistical. Not all lightning or switching surges are dangerous to the insulation and particular specimens need not necessarily flashover or puncture at a particular voltage.
Therefore, it is important to design the insulation of the various equipment to be protected and the devices used for protection not for the worst possible condition but for the worst probable condition as the cost of insulation for a system of a voltage of more than 380 kV are proportional to the square of the voltage and, therefore any small saving in insulation will result in a large sum when considered for such large modern power system.
This, however, would involve some level of risk failure. It is desired to accept some level of risk of failure than to design a risk-free but very costly system.
The statistical methods, however, call for very rigorous experimentation and analysis work to find the probability of the occurrence of overvoltages and the probability of failure of insulation.
It is found that the distribution of breakdown for a given gap follows with some exceptions approximately normal or Gaussian distribution. Similarly, the distribution of overvoltages on the system also follows the Gaussian distribution.
To coordinate electrical stresses due to overvoltages with the electrical strengths of the dielectric media, it has been found convenient to represent overvoltage distribution in the form of the probability density function and the insulation breakdown probability by the cumulative distribution function as shown in Figure 5.
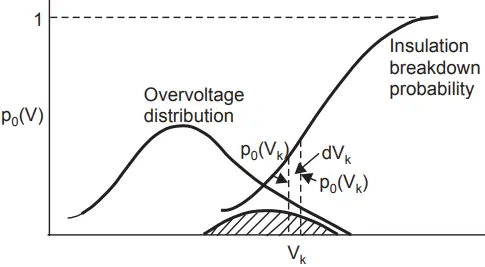
Suppose P0(Vk) is the probability density of an overvoltage Vk and P0 (Vk ) dVk is the probability of occurrence of the overvoltages having a peak value Vk.
To obtain the probability of disruptive discharges due to these overvoltages having a value between Vk and Vk + dVk, their probability of occurrence P0(Vk) dVk, shall be multiplied by Pb(Vk) that an impulse of the given type and value Vk will produce a discharge.
The resultant probability or risk of failure for overvoltage between Vk and Vk + dVk is thus,
dR = Pb(Vk) P0(Vk) dVk
For the total voltage range we obtain the total probability of failure or risk of failure.
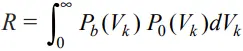
The risk of failure will thus be given by the shaded area under the curve. In actual practice, however, it is uneconomical to use the complete distribution functions for the occurrence of overvoltage and for the withstand of insulation, and, therefore, a compromise solution is adopted as shown in Figure 6 (a) and (b).
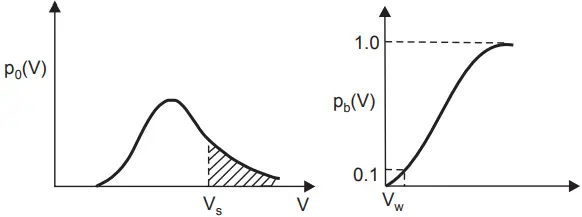
Figure 6 shows the probability of occurrence of overvoltages which will result in breakdown, by the shaded area for voltage greater than Vs known as statistical overvoltage.
In Fig. 6(b) Vw is the withstand voltage which results in flashover only in 10% of applications and for the remaining 90% of applied impulsed, no breakdown of insulation occurs. This voltage is known as statistical withstand voltage Vw.
Fig. 7(a) to (c) show the functions Pb(V) and P0(V) plotted for three different cases of insulation strength, keeping the overvoltage distribution the same. The density function P0(Vk) is the same in (a) to (c) whereas the cumulative function giving the undetermined withstand voltage is gradually shifted along the V-axis towards high values of V.
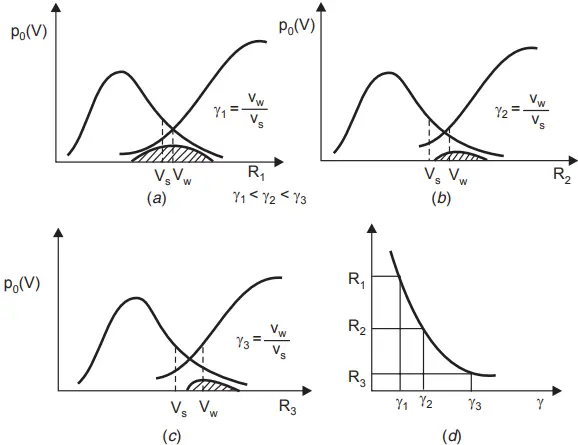
The shifting of the cumulative distribution curve to the right is equivalent to increasing the insulation strength by either using thicker insulation or material of high dielectric strength.
Let the statistical factor of safety be defined as γ = Vw/Vs and as the withstand characteristic is shifted towards the right, the statistical factor of safety increases, and hence the risk of failure decreases as shown in Fig. 7 (d). However, the cost of insulation goes up as the factor of safety is increased.
Related Posts
- Lightning Arrester Types & Working
- Lightning and Switching Voltage Protection Methods
- Personnel Protective Devices
- How Lightning Arrester Works
- Overvoltage Protection by Lightning Arresters
- Insulation coordination of Electrical Equipment
- MCCB Circuit Breakers
- Differential Protection of Generator & Alternator
- Types of Current Limiting Reactor
- Classification | Types of Protective Relays
- Fuse Selection Criteria
- Protection of Transmission lines by Ground Wires